A) 187.5.
B) 375.
C) 600.
D) 750.
F) B) and D)
Correct Answer

verified
Correct Answer
verified
True/False
Y = C + S even when the economy is not in equilibrium.
B) False
Correct Answer

verified
Correct Answer
verified
Multiple Choice
Suppose consumption is $20,000 when income is $32,000 and the MPC equals 0.8. When income increases to $40,000, consumption is
A) $26.400.
B) $28,000.
C) $32,000.
D) $72,000.
F) B) and C)
Correct Answer

verified
Correct Answer
verified
Multiple Choice
Which of the following is an investment?
A) the purchase of a new printing press by a business
B) the purchase of a corporate bond by a household
C) the purchase of a share of stock by a household
D) a leveraged buyout of one corporation by another
F) A) and B)
Correct Answer

verified
Correct Answer
verified
Multiple Choice
Assume that in Scandia, planned investment is $80 billion but actual investment is $60 billion. Unplanned inventory investment is
A) -$20 billion.
B) -$10 billion.
C) $70 billion.
D) $140 billion.
F) A) and C)
Correct Answer

verified
Correct Answer
verified
Multiple Choice
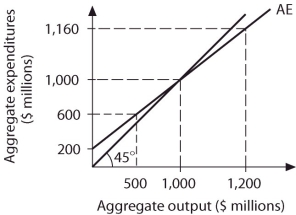
Refer to the information provided in Figure 8.10 below to answer the questions that follow.  Figure 8.10
-Refer to Figure 8.10. At aggregate output levels below $1,000 million, there are
A) unplanned decreases in inventories and output increases.
B) unplanned increases in inventories and output increases.
C) unplanned increases in inventories and output decreases.
D) unplanned decreases in inventories and output decreases.
F) All of the above
Correct Answer

verified
Correct Answer
verified
Multiple Choice
Refer to the information provided in Table 8.10 below to answer the questions that follow.
Table 8.10  -Refer to Table 8.10. Planned saving equals planned investment at an aggregate output level of
A) $2,000 million.
B) $2,400 million.
C) $2,800 million.
D) $3,200 million.
F) C) and D)
Correct Answer

verified
Correct Answer
verified
Multiple Choice
Refer to the information provided in Table 8.1 below to answer the questions that follow.
Table 8.1  -Refer to Table 8.1. Society's MPC is
A) 0.95.
B) 0.90.
C) 0.80.
D) 0.05.
F) None of the above
Correct Answer

verified
Correct Answer
verified
Multiple Choice
Refer to the information provided in Table 8.7 below to answer the questions that follow.
Table 8.7  -Refer to Table 8.7. Planned investment equals actual investment at
A) all income levels.
B) all income levels above $600 billion.
C) all income levels below $600 billion.
D) $1,000 billion.
F) All of the above
Correct Answer

verified
Correct Answer
verified
Multiple Choice
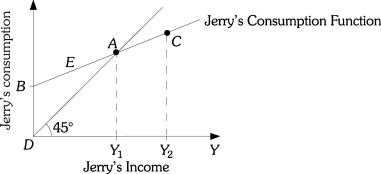
Refer to the information provided in Figure 8.2 below to answer the questions that follow.  Figure 8.2
-Refer to Figure 8.2. Jerry's saving is negative along the line segment
A) AY1.
B) AB.
C) CY2.
D) AC.
F) C) and D)
Correct Answer

verified
Correct Answer
verified
Multiple Choice
If Lily's consumption function is of the form [C = 100 + 0.8Y], her saving equals zero at an income level of
A) 180.
B) 500.
C) 800.
D) cannot be determined from the given information
F) A) and D)
Correct Answer

verified
Correct Answer
verified
Multiple Choice
Which of the following is not considered investment?
A) the acquisition of capital goods
B) the purchase of government bonds
C) the increase in planned inventories
D) the construction of a new factory
F) A) and D)
Correct Answer

verified
Correct Answer
verified
Multiple Choice
Refer to the information provided in Table 8.1 below to answer the questions that follow.
Table 8.1  -Refer to Table 8.1. At an aggregate income level of $100, aggregate saving would be
A) -$70.
B) -$30.
C) $50.
D) $70.
F) A) and B)
Correct Answer

verified
Correct Answer
verified
Multiple Choice
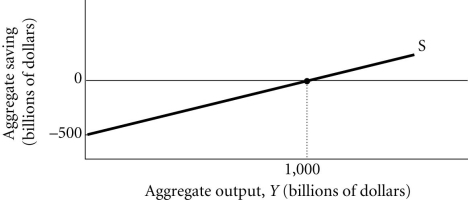
Refer to the information provided in Figure 8.1 below to answer the questions that follow.  Figure 8.1
-Refer to Figure 8.1. This household consumes ________ at an income level of $3,000.
A) $1,000
B) $1,450
C) $2,000
D) $3,500
F) All of the above
Correct Answer

verified
Correct Answer
verified
Multiple Choice
Refer to the information provided in Table 8.10 below to answer the questions that follow.
Table 8.10  -Refer to Table 8.10. At an aggregate output level of $2,000 million, planned expenditure equals
A) $2,200.
B) $2,500.
C) $2,700.
D) $4,700.
F) A) and C)
Correct Answer

verified
Correct Answer
verified
Multiple Choice
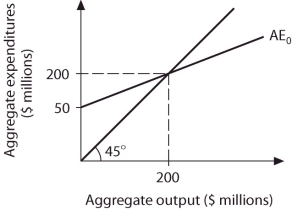
Refer to the information provided in Figure 8.11 below to answer the questions that follow.  Figure 8.11
-Refer to Figure 8.11. A $10 million increase in investment changes equilibrium output to
A) $240 million.
B) $225 million.
C) $175 million.
D) $90 million.
F) All of the above
Correct Answer

verified
Correct Answer
verified
True/False
Firms react to negative inventory investment by increasing output.
B) False
Correct Answer

verified
Correct Answer
verified
Multiple Choice
If planned investment is ________ to changes in the interest rate, the planned investment schedule is vertical.
A) positively related
B) negatively related
C) perfectly unresponsive
D) perfectly responsive
F) C) and D)
Correct Answer

verified
Correct Answer
verified
True/False
Reducing the interest rate, ceteris paribus, is likely to reduce the level of planned investment spending.
B) False
Correct Answer

verified
Correct Answer
verified
Multiple Choice
A decrease in planned investment causes
A) output to increase.
B) output to decrease, but by a smaller amount than the decrease in investment.
C) output to decrease, but by a larger amount than the decrease in investment.
D) output to decrease by an amount equal to the decrease in investment.
F) A) and C)
Correct Answer

verified
Correct Answer
verified
Showing 221 - 240 of 355
Related Exams