A) resources are distributed unevenly.
B) the members of the population are competing for access to a resource.
C) the members of the population are neither attracted to nor repelled by one another.
D) the density of the population is low.
F) A) and C)
Correct Answer

verified
Correct Answer
verified
Multiple Choice
Which of the following statements about human populations in industrialized countries is incorrect?
A) Birth rates and death rates are high.
B) Average family size is relatively small.
C) The population has undergone the demographic transition.
D) The survivorship curve is Type I.
F) A) and C)
Correct Answer

verified
Correct Answer
verified
Multiple Choice
Which of the following statements about human population in industrialized countries are correct? I.Life history is r-selected. II.The population has undergone the demographic transition. III.The survivorship curve is Type III. IV.Age distribution is relatively uniform.
A) only I and III
B) only II and IV
C) only I, II, and IV
D) only II, III, and IV
F) B) and D)
Correct Answer

verified
Correct Answer
verified
Multiple Choice
Which pair of terms most accurately describes life history traits for a stable population of wolves?
A) semelparous; r-selected
B) semelparous; K-selected
C) iteroparous; r-selected
D) iteroparous; K-selected
F) B) and D)
Correct Answer

verified
Correct Answer
verified
Multiple Choice
Suppose researchers marked 800 turtles and later were able to trap a total of 300 individuals in that population, of which 150 were marked. What is the estimate for total population size?
A) 200
B) 1,050
C) 1,600
D) 2,100
F) A) and C)
Correct Answer

verified
Correct Answer
verified
Multiple Choice
Which of the following assumptions must be made regarding the mark-recapture estimate of population size? I. Marked and unmarked individuals have the same probability of being trapped. II. The marked individuals have thoroughly mixed with the population after being marked. III.No individuals have entered or left the population by immigration or emigration, and no individuals have been added by birth or eliminated by death during the course of the estimate.
A) I only
B) II only
C) I and II only
D) I, II, and III
F) All of the above
Correct Answer

verified
Correct Answer
verified
Multiple Choice
Uniform spacing patterns in plants such as the creosote bush are most often associated with ________.
A) patterns of high humidity
B) the random distribution of seeds
C) competitive interaction between individuals of the same population
D) the concentration of nutrients within the population's range
F) All of the above
Correct Answer

verified
Correct Answer
verified
Multiple Choice
An ecologist recorded 12 white-tailed deer, Odocoileus virginianus, per square kilometer (km²) in one woodlot and 20 km² in another woodlot. What was the ecologist comparing?
A) density
B) dispersion
C) carrying capacity
D) range
F) A) and D)
Correct Answer

verified
Correct Answer
verified
Multiple Choice
Scientific study of the population cycles of the snowshoe hare and its predator, the lynx, has revealed that
A) predation is the dominant factor affecting prey population cycling.
B) hares and lynx are so mutually dependent that each species cannot survive without the other.
C) both hare and lynx population sizes are affected mainly by abiotic factors.
D) the hare population is r-selected and the lynx population is K-selected.
F) None of the above
Correct Answer

verified
Correct Answer
verified
Multiple Choice
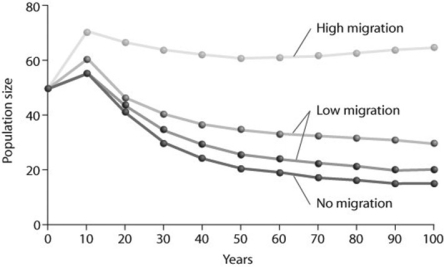
Use the graph to answer the following question.
 Looking at the figure, what factor is contributing significantly to stabilizing the population size over time?
I. no migration
II. low migration
III.high migration
A) only I
B) only II
C) only III
D) only II and III
F) A) and B)
Correct Answer

verified
Correct Answer
verified
Multiple Choice
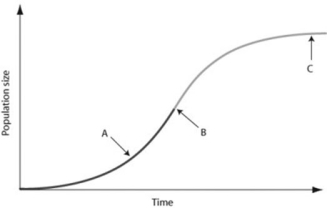
Use the graph to answer the following question.
 In the figure, which of the arrows represents the carrying capacity?
A) arrow A
B) arrow B
C) arrow C
D) Carrying capacity cannot be found in the figure because species under density-dependent control never reach carrying capacity.
F) A) and C)
Correct Answer

verified
Correct Answer
verified
Multiple Choice
According to the logistic growth equation below,
 = rN
= rN 
A) the number of individuals added per unit time is greatest when N is close to zero.
B) the per capita population growth rate increases as N approaches K.
C) population growth is zero when N equals K.
D) the population grows exponentially when K is small.
F) A) and C)
Correct Answer

verified
Correct Answer
verified
Multiple Choice
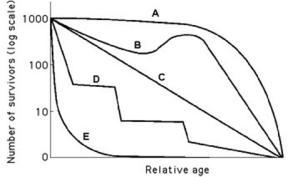
Use the survivorship curves in the figure to answer the following question.
 Which curve best describes survivorship in marine mollusks?
A) A
B) B
C) C
D) E
F) All of the above
Correct Answer

verified
Correct Answer
verified
Multiple Choice
Which of the following graphs illustrates the population growth curve starting with a single bacterium growing in a flask of ideal medium at optimum temperature over a two-hour period? Assume resources do not become limiting over this time frame.
A) ![]()
B) ![]()
C) ![]()
D) ![]()
F) B) and C)
Correct Answer

verified
Correct Answer
verified
Multiple Choice
The following question refers to the figure below, which depicts the age structure populations.
 In the figure, populations of a plant species labeled I, II, and III are depicted using simplified age structures containing three age classes: young seedlings, middle-aged juveniles, and older adults. Which population(s) appear(s) to have stable growth?
A) I
B) III
C) I and II
D) II and III
F) B) and D)
Correct Answer

verified
Correct Answer
verified
Multiple Choice
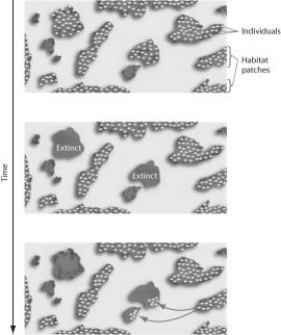
Use the figure to answer the following question.
 The figure represents the dynamics of ________.
A) metapopulations
B) extinction
C) emigration
D) both extinction and emigration
F) A) and C)
Correct Answer

verified
Correct Answer
verified
Multiple Choice
Which of the following graphs illustrates the growth over several seasons of a population of snowshoe hares that were introduced to an appropriate habitat also inhabited by predators in northern Canada?
A) ![]()
B) ![]()
C) ![]()
D) ![]()
F) C) and D)
Correct Answer

verified
Correct Answer
verified
Multiple Choice
Which of the following is the most important assumption for the mark-recapture method to estimate the size of wildlife populations?
A) More individuals emigrate from, as opposed to immigrate into, a population.
B) Over 50% of the marked individuals were trapped during the recapture phase.
C) There is a 50:50 ratio of males to females in the population before and after trapping and recapture.
D) Marked individuals have the same probability of being recaptured as unmarked individuals during the recapture phase.
F) None of the above
Correct Answer

verified
Correct Answer
verified
Multiple Choice
Which of the following statements regarding the future of populations in developing, less industrialized countries are correct? I.The reproductive rates are predicted to remain below replacement level. II. Survivorship will increase. III.Overall population size will increase dramatically. IV.The fertility rate is predicted to remain high, especially in some regions.
A) only I and III
B) only II and IV
C) only II, III, and IV
D) only I, II, and III
F) A) and C)
Correct Answer

verified
Correct Answer
verified
Multiple Choice
Use the table to answer the following question.
 In the accompanying life table of a hypothetical population, what are the missing values for lₓ (y and z) ? lₓ = the proportion alive at the start of year (age specific survivorship rate) .
A) y = 0.5, z = 0.5
B) y = 1.0, z = 0.5
C) y = 0.5, z = 0.1
D) y = 1.0, z = 0.2
F) A) and B)
Correct Answer

verified
Correct Answer
verified
Showing 21 - 40 of 69
Related Exams